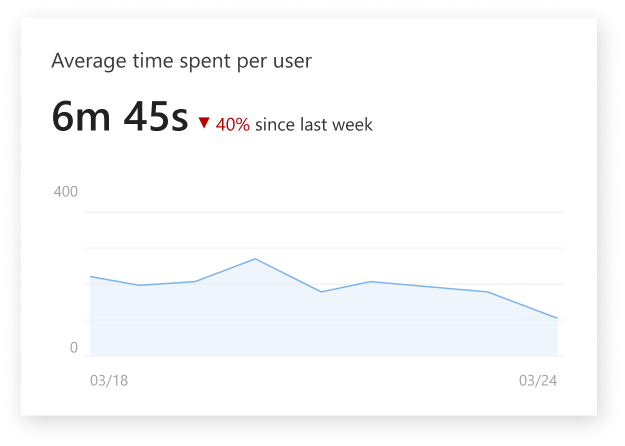
We are adding a report on the SharePoint site usage page, Average time spent per user.
This message is associated with Microsoft 365 Roadmap ID 57159.
When this will happen
- We’ll be gradually rolling this out mid-June 2020.
- The rollout will be completed by mid-July.
The Average time spent per user report shows the trend line for the time users spent on SharePoint site pages and news posts for 7-day and 30-day periods. The average metric is calculated by comparing the total time spent on that page with the number of the unique visitors on that page in the given timeframe.
This report currently does not provide the average value for 90-day period and does not support lists, documents, or administrative pages (such as the site usage or site permissions page). Mobile app views are currently not incorporated in this report.
In this example, the report shows that the average user spent 6 minutes and 45 seconds actively engaged with the site during a 7-day period. This is a 40% decrease from the prior 7-day period.
You might consider updating your user training and documentation.


